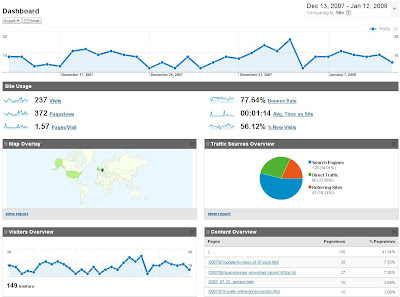
The visitor overview below shows that throughout the year we're averaging about 10 visitors a day, with the obvious spike in interest after Rosalie's birth in July.

The dashboard view below for the last month bears this out with some interesting stats on Pages/Visit, average time on site etc. Of course, the accuracy of these figures are limited by the manner in which they are gathered - for example a single visit may be read for a while, but will always be recorded as 0 seconds if the next page is off-site, but these are standard deficiencies in web analytics.

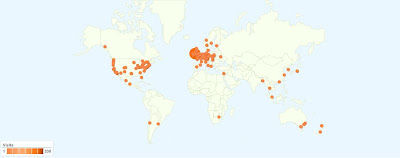
One graph I always like to check out is the Map Overlay, below the city view is shown. This blog has been viewed on all continents, and from 52 countries. A warm welcome to all readers in Uzbekistan, Bangladesh, Chile, United Arab Emirates and Senegal. Just why there was a visit from Quantico, Virginia, USA is still a mystery to me - what interest could the FBI, Marine Corps or the Drug Enforcement Administration have in me? Surely not my harsh stance on copy protection mechanisms for Digital Media :-)

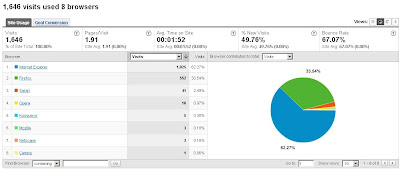
On a lighter note, it's fun to see what browsers visitors to this site are using. Internet Exploder remains the top weapon of mass distraction, but at just over 33%, Firefox is gaining ground.

BTW, it's not depicted here but the OS split is 94%, 5% and 1% for Windows, Mac and Linux respectively. There's still some work to do for Linux on the desktop ;-)

No comments:
Post a Comment